
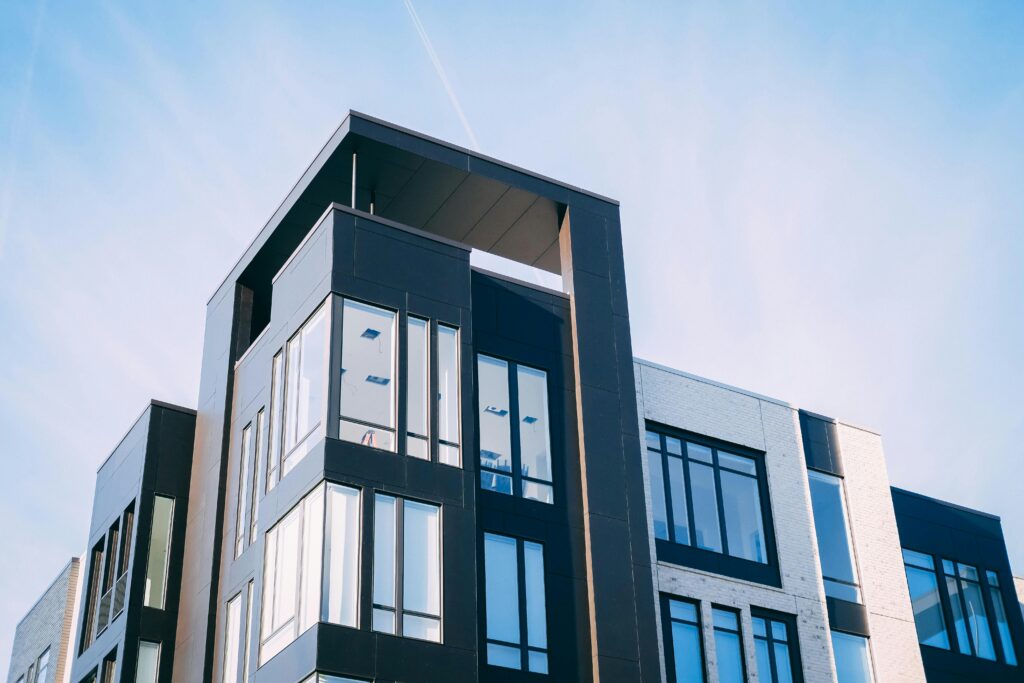
You’re looking at a 12-unit apartment building in a secondary market. The seller is asking $1.4 million. Rents are at market. The broker’s marketing email says the cap rate is 6.2%. Now what? Whether that’s a good deal depends on how you run your own multifamily cap rate analysis — not the seller’s numbers, and certainly not what the broker told you.
This guide walks through how experienced investors actually underwrite a 5–20 unit deal: building the NOI from scratch, benchmarking the cap rate against current market data, and understanding how lenders use cap rates to size your loan.
What You’ll Learn
- How to calculate NOI correctly — and why brokers often inflate it
- Current 2026 cap rate benchmarks by asset class and market
- How lenders use cap rate in multifamily underwriting
- What going-in vs. stabilized cap rate means for your financing
What Is a Cap Rate — and What It’s Actually Measuring
Cap rate is straightforward in theory: Net Operating Income ÷ Purchase Price (or Market Value). A property producing $80,000 in NOI purchased for $1,333,333 has a 6.0% cap rate.
What it measures is the property’s unleveraged annual yield — the return you’d earn if you bought it in all cash. No mortgage, no debt service. That’s why it’s the go-to metric for comparing properties across different markets and capital structures.
What cap rate doesn’t measure: your actual cash-on-cash return (which factors in debt service) or total return (which includes appreciation). Cap rate is a snapshot of current income performance, not a complete investment thesis.
Building NOI From Scratch — Don’t Use the Seller’s Number
This is where most buyers make their first mistake. Broker-provided cap rates almost always use the seller’s NOI, which tends to be optimistic — through inflated vacancy assumptions, omitted expenses, or a missing management fee.
Build your own NOI in four steps:
Step 1: Gross Potential Income (GPI)
Multiply current market rents by 12 months by number of units. This is the maximum the property could collect at 100% occupancy. Use market rents you’ve verified independently — not actual collected rents, which may reflect below-market leases.
Step 2: Effective Gross Income (EGI)
Subtract a vacancy and credit loss allowance. For stabilized small multifamily in 2026, I typically underwrite 5–8% vacancy depending on market. Tighten that assumption only if the building has a documented 3-year history at lower vacancy.
Step 3: Operating Expenses
A complete expense load for a 5–20 unit property includes: property taxes, insurance, utilities (common area), repairs and maintenance, property management (8–10% of collected rents — add this even if the seller self-manages, because a lender will), landscaping, janitorial, professional fees, and a replacement reserve ($200–400/unit/year is standard). Any expense the seller omitted goes back in. Management is the most common omission. Reserves are a close second.
Step 4: NOI = EGI − Total Operating Expenses
Run that through your analysis and divide by the asking price. That’s the cap rate you’re actually buying at — often 50–100 basis points lower than the listing says.
2026 Multifamily Cap Rate Benchmarks
Where should your deal land? It depends on asset class and market. CBRE’s H1 2026 Cap Rate Survey, drawing on 3,600 estimates across 50+ U.S. markets, puts multifamily cap rates in the following ranges:
| Asset Class | Primary Markets | Secondary Markets | Tertiary / Smaller Markets |
|---|---|---|---|
| Class A (institutional-grade) | 4.74% | 5.25–5.75% | 5.75–6.25% |
| Class B | 4.92–5.5% | 5.5–7.0% | 6.5–7.5% |
| Class C / workforce housing | 5.38–6.5% | 6.5–8.0% | 7.5–9.0%+ |
For the 5–20 unit segment specifically, cap rates track closer to Class B and C ranges. Small multifamily cap rates dipped to approximately 5.8% nationally in Q1 2026 (down from 6.1% the prior quarter) as lending conditions stabilized. The MBA reported multifamily originations up 8% year-over-year in Q2 2026, with overall commercial real estate lending up 16% — a signal of renewed lender appetite in the sector.
Underwriting a 5–20 unit acquisition? We structure multifamily financing nationally across agency, portfolio, bridge, and small-balance programs. Send us your deal →
How Lenders Use Cap Rate in Underwriting
Most investors treat cap rate as a buyer’s metric. It’s also a lender’s metric — but they use it differently than you might expect.
Commercial lenders use cap rate alongside DSCR and debt yield to determine maximum loan proceeds. Here’s how that works in practice for a 5–20 unit deal:
DSCR constraint: Your NOI must cover debt service by a minimum factor. Most commercial lenders require 1.20x–1.25x DSCR for small multifamily. If annual debt service is $70,000, you need at least $84,000–$87,500 in lender-underwritten NOI to qualify.
LTV constraint: Most lenders cap LTV at 70–75% for stabilized small multifamily. Value-add or lease-up scenarios typically get 60–65% at the going-in value.
Debt yield constraint: Many lenders apply a debt yield test on top of DSCR: NOI ÷ Loan Amount must exceed 8–10%. A $900,000 loan on a property with $80,000 NOI produces 8.9% debt yield — most lenders would approve that, though it’s on the lean side.
Your cap rate directly feeds all three of these metrics. A 5.5% going-in cap on a $1.4M purchase means roughly $77,000 in NOI. Whether that supports a 75% LTV loan at today’s rates depends on current rate levels — run both the DSCR and debt yield calculations before assuming the deal works.
For more on how these metrics connect, see our posts on how lenders calculate NOI on commercial loans and what DSCR lenders actually require in 2026.
Going-In Cap Rate vs. Stabilized Cap Rate
For value-add deals, you need two cap rates in your analysis: the going-in cap rate (what you’re buying at today) and the stabilized cap rate (projected NOI after improvements, at current market value).
Most lenders underwrite to the going-in cap rate when sizing your loan. They’re not lending against projected rents. But understanding the stabilized cap tells you whether the business plan makes economic sense and what your exit or refinance looks like when you get there.
A value-add deal bought at a 6.5% going-in cap that stabilizes to 7.5% (on the same price basis) has created real equity through operations. A deal bought at a 5.0% going-in cap that stabilizes to 5.8% still pencils, but the execution margin is thinner and the business plan has to work.
From a recent deal: I worked with an investor acquiring a 16-unit Class B building in a mid-size Tennessee market. The seller’s broker marketed it at a 6.8% cap, but when I built the NOI independently — adding a 9% management fee the seller had excluded and adjusting vacancy from 3% to 6% — the going-in cap came out to 5.9%. The deal still made sense, but only at a price roughly $85,000 below ask. The lender sized the loan off our adjusted NOI, which confirmed the underwriting approach.
When a Low Cap Rate Is a Warning Sign
Low cap rates in supply-constrained primary markets often reflect legitimate investor confidence in rent growth and appreciation. But a low cap rate on a small multifamily deal in a B or C market deserves more scrutiny.
Factors that compress a cap rate artificially:
- Below-market rents that haven’t been raised (shows as lower income, not higher value)
- Deferred maintenance not reflected in the expense load
- Short-term tenant concessions masking real vacancy
- Overpricing relative to actual sale comps
A cap rate at or below your financing rate — sometimes called negative leverage territory — means the property cash flows negatively from day one on a leveraged basis. I see this occasionally on value-add plays where investors are underwriting to future rents that haven’t materialized yet. It’s not automatically wrong, but you need a clear path to NOI growth and the cash reserves to carry the deficit.
For a deeper look at how cap rates factor into income-property valuation, see our guide to cap rates in commercial real estate.
Frequently Asked Questions
What is a good cap rate for multifamily in 2026?
For 5–20 unit properties in secondary markets, a good going-in cap rate falls between 5.5% and 7.5%, depending on asset class, condition, and market. Class B in a secondary Sunbelt market at 6–7% is considered solid in the current environment.
How do lenders use cap rates to size a multifamily loan?
Lenders apply your NOI to a DSCR test (typically 1.20–1.25x minimum) and a debt yield test (8–10%) to determine maximum loan proceeds. The cap rate drives the NOI figure, which drives both calculations. A lower cap rate on the same purchase price means less NOI and a smaller supportable loan.
Should I use the seller’s cap rate in my underwriting?
Use it as a starting point only. Build your own NOI from scratch, restore any omitted expenses, and verify vacancy against market data. Seller-provided cap rates are a marketing number — lenders will run their own underwriting, and so should you.
What is negative leverage in multifamily investing?
Negative leverage occurs when your going-in cap rate falls below your mortgage interest rate. Adding debt reduces your cash-on-cash return rather than enhancing it. It’s most common in compressed primary markets and is only justifiable when you have strong conviction on near-term rent growth.
Ready to finance your multifamily acquisition?
We work with investors nationally on 5+ unit apartment acquisitions, value-add bridge financing, and permanent agency loans. Send us your scenario — we’ll respond within one business day with realistic loan terms and program options.
This article is for informational purposes only and does not constitute financial, legal, or tax advice. Loan terms, rates, and availability vary by borrower, property, and market conditions. Consult Willowbrook Capital for scenario-specific guidance.
